Infographics are an increasingly popular way of storytelling and as designer Jess Foley and editor Katie Smith discovered, the key to making them impactful is simplicity.
At AB we pride ourselves on telling great stories for our clients. We use Infographics to provide impactful solutions that can change the way people find, experience and interact with our stories.
We recently attended a ‘Storytelling with Infographics’ course at The Bridge in London, run by experienced information designer and visual communicator Nigel Hawtin.
The aim was for us to build on our knowledge of infographics to further enhance our storytelling and data visualisation.
Information graphics and data visualisations are visual representations of information, data or knowledge.
Nigel quoted visual journalist and author of The Truthful Art: Data, Charts, and Maps for Communication, Alberto Cairo:
“The purpose of infographics and data visualisations is to enlighten people – not to entertain them, not to sell them products, services, or ideas, but to inform them. It’s as simple – and as complicated – as that.”
One of the main takeaways from the course was that a visual should have an impact on those looking at it in three to five seconds.
This can be achieved a multitude of ways, from the use of bar graphs to coordinates, but one of the most important things is to make sure you fully understand every aspect of the information you are working with. By understanding these elements you are able to present it to your audience effectively and communicate the main point without distracting, hiding or distorting it.
Regardless of who the infographic is targeted at, the key element remains information. Nigel explained that 60 per cent of our brain capacity absorbs visual information, which leads us to the graphic below.
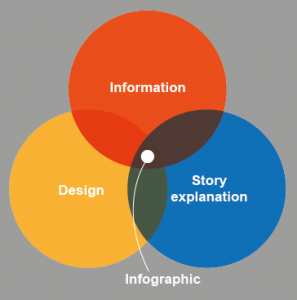
The infographic is the sweet spot in the middle. However, it’s essential to remember that no one of these elements is more important than the other.
Ultimately, infographics should tell your audience what you want them to know. An infographic should be able to convey a message quickly without reading the words necessarily.
“Simplification means eliminating the unnecessary so that the necessary may speak” – graphic designer Nigel Holmes.
But note that this doesn’t mean getting rid of the important information. In other words, keep the info in Infographics.